How I Use AI in My FPGA Workflows
In the last few years, AI has become a very important asset in the life of engineers, especially those who write code. And honestly, if you are one of those developers who refuse to use AI because of… principles?, you are going to work slower, or even worse, than the developers who do use it. In the same way, if you are in the AI fan zone, relying on AI for every line of code without very strong guidelines and with very limited guardrails, you are going to work fast, but neither well nor efficiently.
In my case, I started out refusing AI about two years ago. Then, last year, I started using it to review code, then I delegated some testbenches and scripting to AI, and today AI writes and verifies 80% of my code and, most importantly, it writes it the way I would. At the FPGA Developers’ Forum, Adam Taylor talked about this topic, and he explained that AI is one more member of the team, one that needs to follow rules, needs to test its code, needs to write documentation… and also needs its code to be reviewed by a teammate, for example, in a merge request.
In the last months I have written several articles about AI and FPGAs. I showed you how to use a Red Pitaya as an MCP verification bench, and how I run local models to review Verilog. Those were individual pieces, but I never explained how they fit together in my day-to-day work. So in this article I want to show you the complete picture: how I organize the rules that the AI follows, what the commands I use actually do, and, the part I find most interesting, how I started to verify the generated modules on a real FPGA using a custom tool.
The short version is that the AI is not the important part of the workflow. The important part is the knowledge base that the AI and I read every time we do something (in my case, I remember it because my context length is larger).
Table of contents
- The complete flow
- What is in the notes
- What the commands do
- Verification on a real FPGA: Tramuntana
- Another option: everything inside the FPGA with a PCIe accelerator
- Conclusions
The complete flow
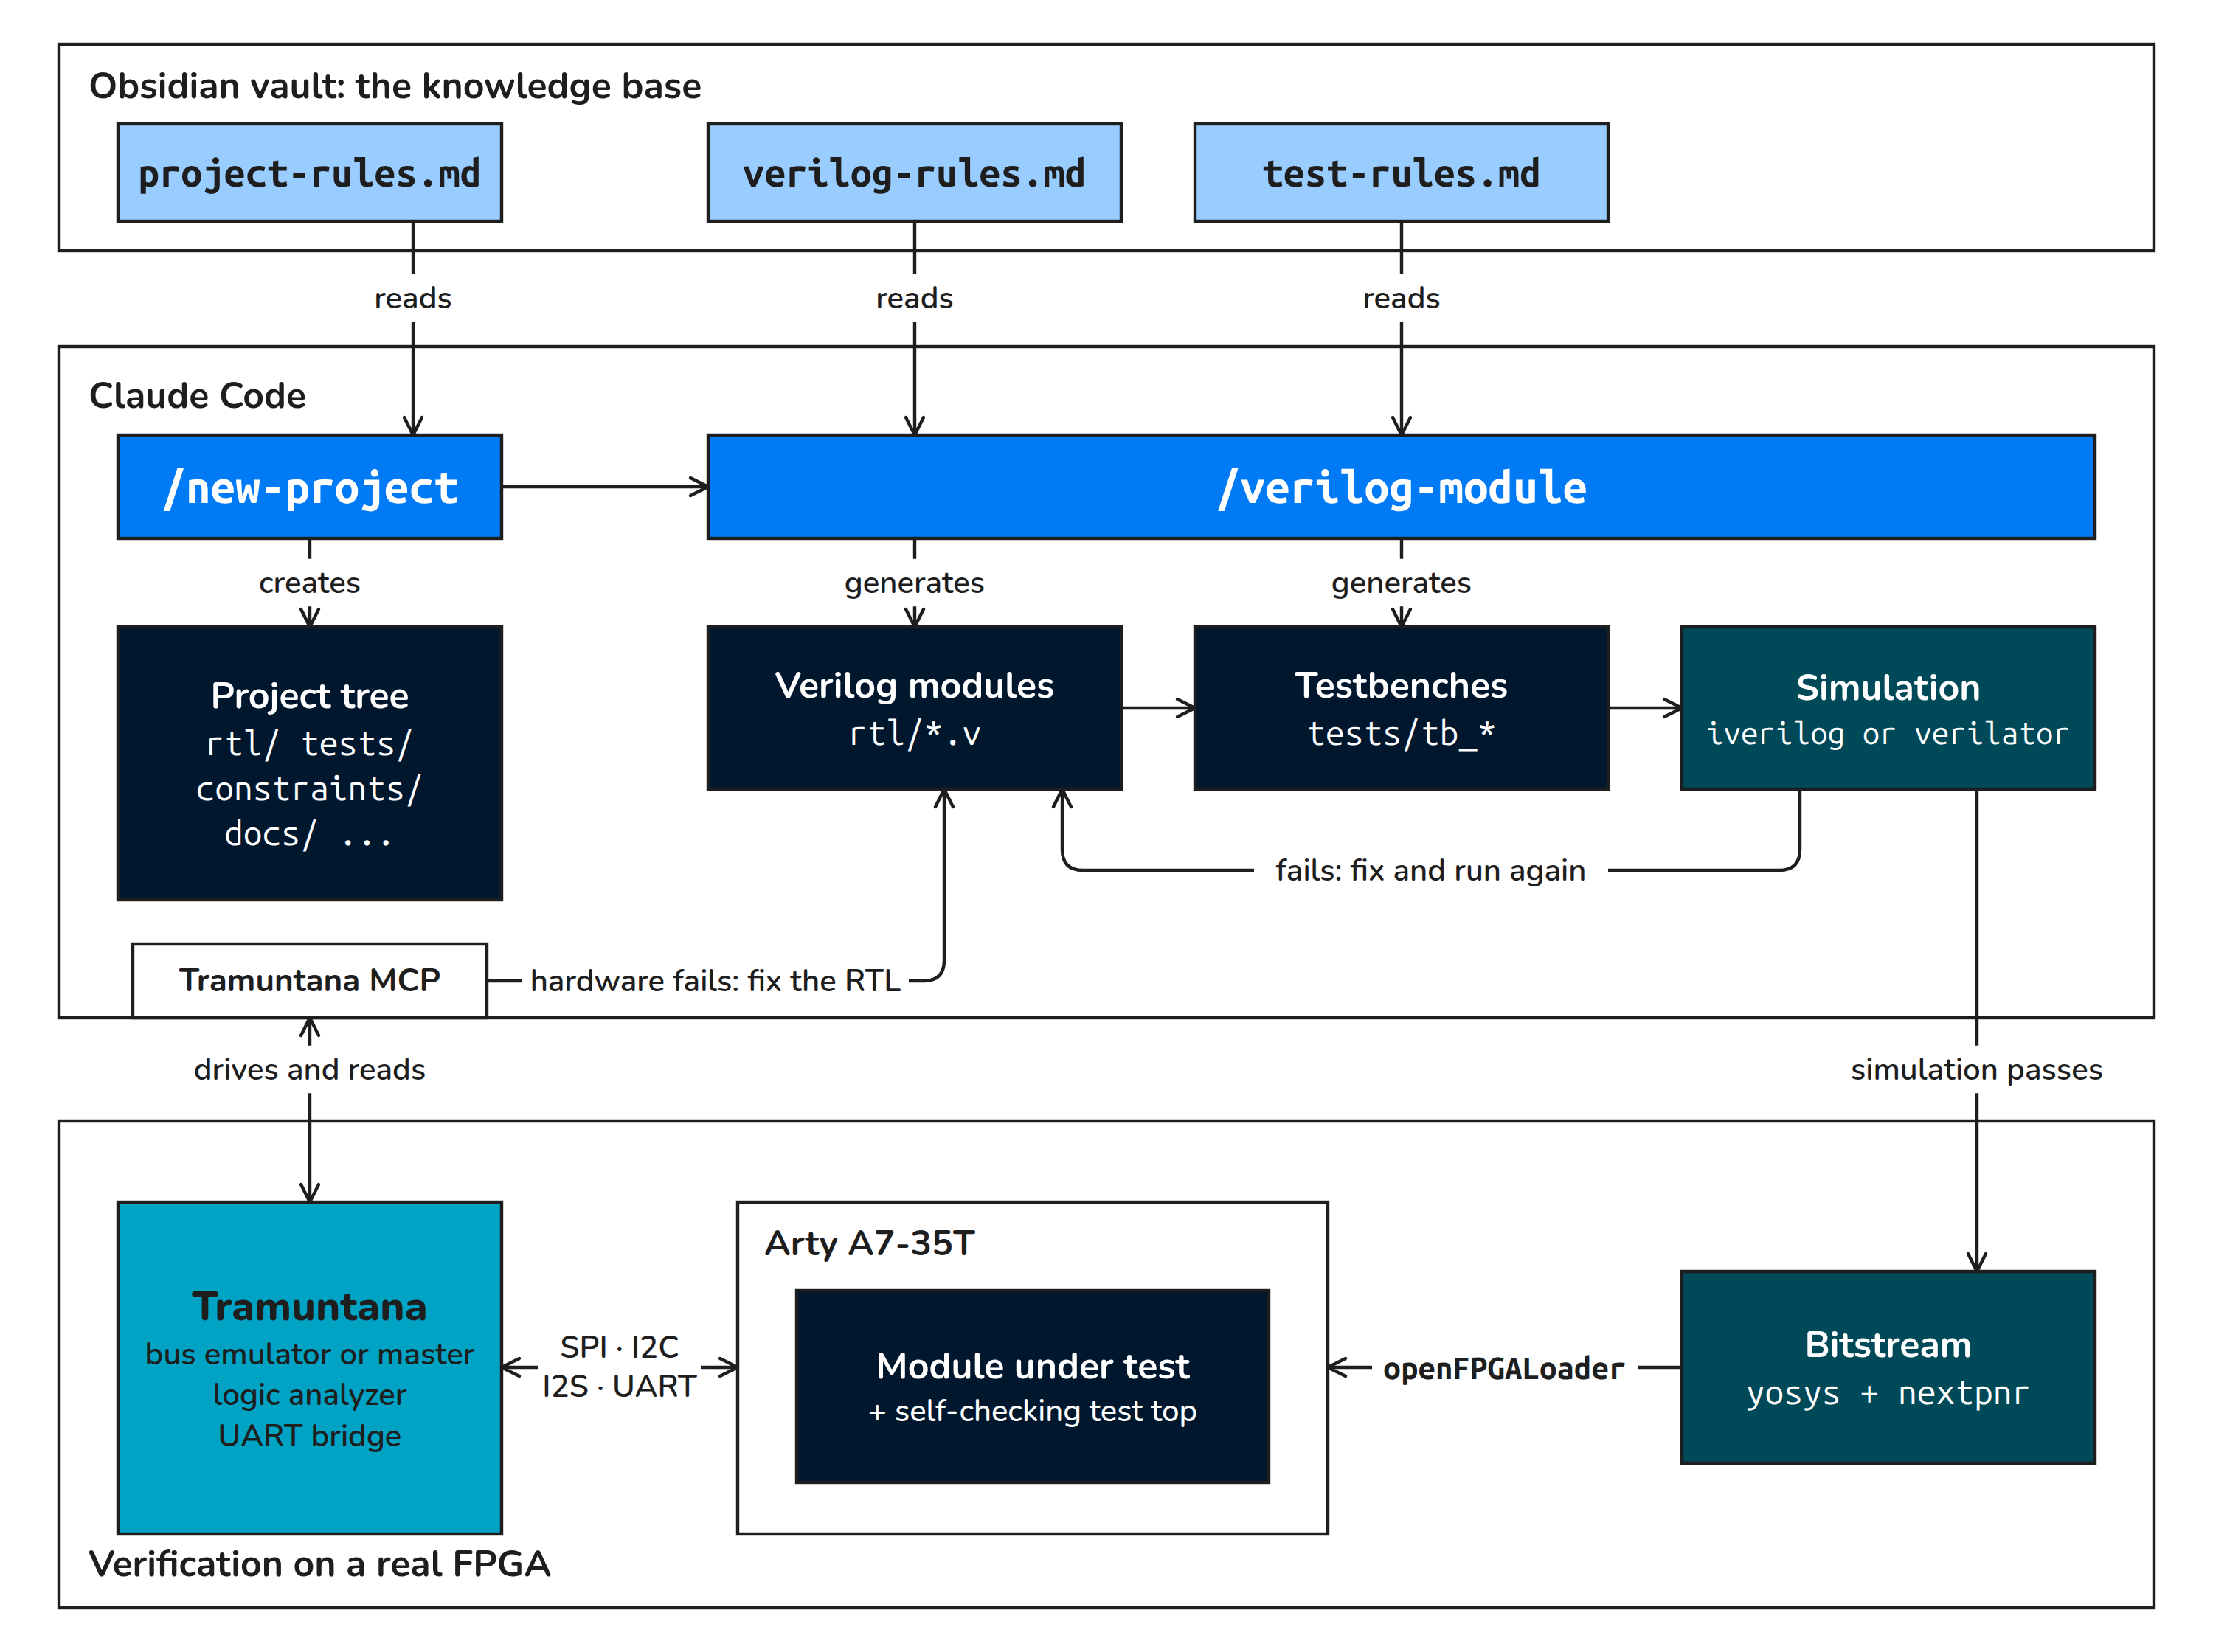
The central idea is that the rules do not live in the prompt, and they do not live in the project either. They live in a knowledge base in Obsidian. The Claude Code commands read those notes every time they are executed, so when I improve a rule, every project that comes after inherits it. I already mentioned this in the article about local AI, and I insist on it because it is the decision that has had the biggest impact on the quality of what I get: a single source of truth, referenced by every command of every tool.
The diagram has three levels and two loops. The first level is Obsidian, which holds what I know and how I want things to be done. The second level is Claude Code, with the commands, the orders, that apply that knowledge and generate the project, write the code and test it. The third level is the real FPGA, which checks that what happens in simulation also happens in hardware.
The inner loop iterates against the simulator: the model writes RTL, runs the testbench, reads the log, fixes and runs again until everything passes. The outer loop iterates against the hardware. Whatever fails in the outer loop goes back to the RTL and repeats the whole path, including the simulation, so a fix for a hardware problem never breaks what was already verified.
What is in the notes
The actual content of the rules depends on you, your team and the way you usually work, so sharing mine doesn’t make any sense, but I am going to show you what each one describes.
The first note is project-rules.md, which describes how a project is organized: the directory tree, what goes in each folder, what is excluded from git, which minimum documentation every project carries and how files are named. It sounds boring, but it is what makes every project look the same, and that matters a lot when an agent has to navigate a project it did not create. The best part is that you just need to write it once.
The second one is verilog-rules.md, which describes how the RTL has to be. Code style, naming, clock and reset conventions, preferred interfaces, and the constructions I do not want to see. For example, all my resets are synchronous, and that is written there once, not repeated in every prompt. This note is probably the one with the most iterations.
The third one is test-rules.md, and it is probably the most important one. It defines what I consider a verified module: the structure of the testbench, the fact that testbenches must check themselves (no looking at waveforms to decide whether a test passes), which cases must be covered and how the result is reported. If the testbench cannot say PASS or FAIL by itself, the agent cannot iterate, because it has no way to know whether its last change fixed something. This note includes, for example, a part that explains how to test a DSP algorithm or how to generate the signals.
What the commands do
On top of those notes there are two Claude Code commands.
The first one is /new-project. It reads project-rules.md and creates the directory tree of the project (rtl/, tests/, constraints/, docs/…). When it finishes, it hands over to /verilog-module to generate the modules the project needs.
The second one, /verilog-module, reads verilog-rules.md and test-rules.md and does three things. It generates the Verilog modules in rtl/, it generates their testbenches in tests/, and it simulates them with iverilog or Verilator, iterating, fixing and running again, until they pass.
There is one step of the real flow that is not in the diagram and that I think deserves a mention: the mutation test. Once the testbench passes, bugs are injected on purpose in the RTL (in the spi_master, six of them) to check that the testbench catches them. A testbench that passes is only useful if it can also fail, and when the same model writes the module and its testbench, this is the cheapest way I know to check that it did not write a testbench that agrees with everything.
Verification on a real FPGA: Tramuntana
Passing simulation is not enough, and this is where Tramuntana comes in. Tramuntana is an open test bench based on the RP2350, and Claude Code drives it through its MCP server. It plays two roles at the same time: it is the counterpart of the module under test, and it is also the instrument that observes it.
The bench is simple. An Arty A7-35T (or any other FPGA board) with a Tramuntana Lite connected to the Pmod JB. The bitstreams are generated with open-source tools (yosys, nextpnr-xilinx and prjxray, from the regymm/openxc7 docker image) and loaded with openFPGALoader.
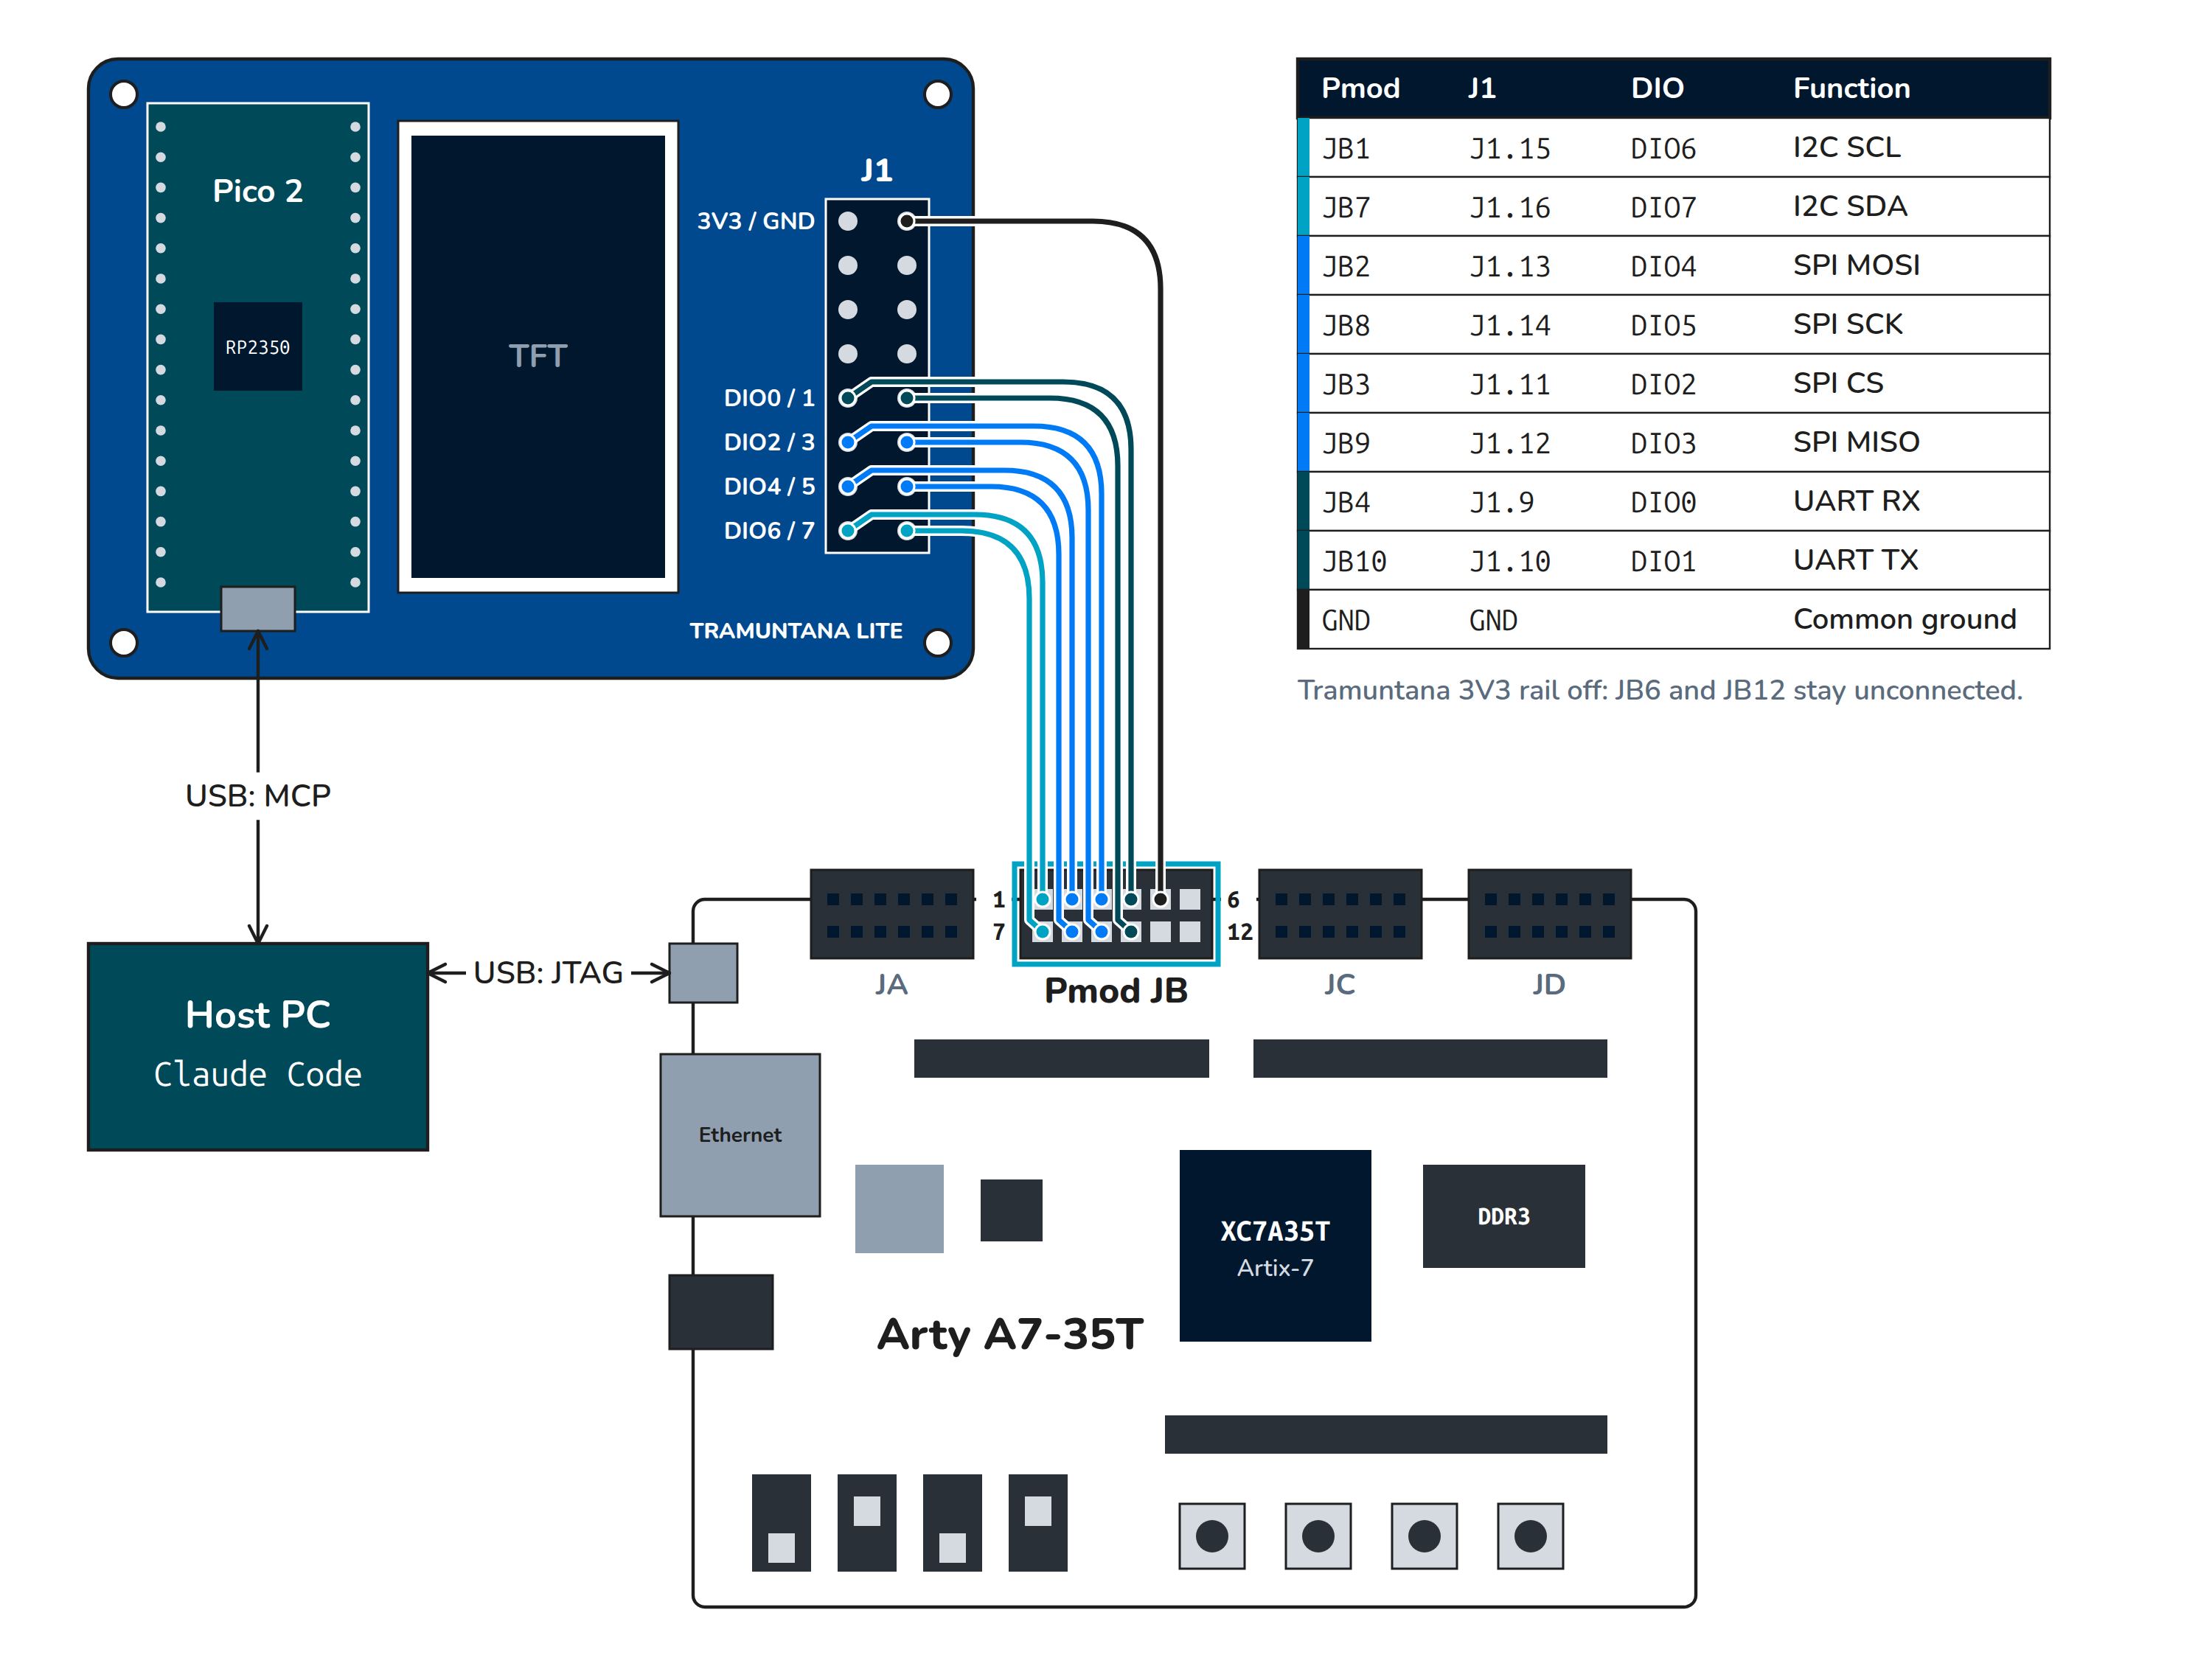
The eight DIO lines and ground go with jumper wires from the J1 header of the Tramuntana to the Pmod JB, each colour is a bus (SPI, I2C or UART), and the 3V3 rail is off because the Arty has its own supply. The host talks to both boards over USB: to the Arty over JTAG to load the bitstream, and to the Tramuntana through its MCP server.
The way it is used is always the same. Each module is integrated into a test top that checks itself in the FPGA and counts its own errors. Claude configures the Tramuntana, launches the test, reads the results and decides whether the RTL needs to change. I tested this flow by creating an RTL library with different interfaces. Depending on the interface you need to verify, the Tramuntana plays a different role:
| Module | Role of the Tramuntana |
|---|---|
spi_master |
SPI emulator (slave) + logic analyzer |
spi_slave |
SPI master + logic analyzer |
i2c_master |
I2C emulator + analyzer + sniffer |
i2s_master |
logic analyzer + UART bridge |
i2s_slave |
PWM as BCLK/LRCLK + analyzer + UART bridge |
Each module of the library carries its rtl/, tests/, sim/Makefile, a hw/ folder with the Arty top, the XDC and the hardware test, and a verification report in docs/. Simulating and testing a module on the board is a matter of three commands:
# simulate a module
cd spi_slave/sim && make

# build and test it on the Arty (Tramuntana wired to Pmod JB)
cd spi_slave
NAME=mode0 PARAMS="cpol=0 cpha=0" ../common/scripts/build.sh . spi_slave_arty
../.venv/bin/python hw/hw_test.py --modes 0
These are the results I got for the five interface modules that are finished:
| Module | Hardware result |
|---|---|
i2c_master |
58 543 write/read-back loops, 0 failures, at 100 kHz / 400 kHz / 1 MHz |
i2s_master |
680/680 frames correct, up to 12.5 MHz BCLK |
i2s_slave |
1233/1233 frames correct, up to 9.375 MHz BCLK |
spi_master |
143 431 read-backs, 0 failures, up to 3.85 MHz |
spi_slave |
8000 read-backs, 0 failures, up to 10.71 MHz |
Another option: everything inside the FPGA with a PCIe accelerator
I want to be clear here: this is an idea I am working on now, but this base design does not exist yet.
The idea is the same as with the Tramuntana, but without wires. An accelerator card plugged into the PC carries a fixed base design, and the design I want to test is inserted inside it. The instruments are no longer an external board, they become logic inside the same FPGA, and Claude drives them over PCIe.
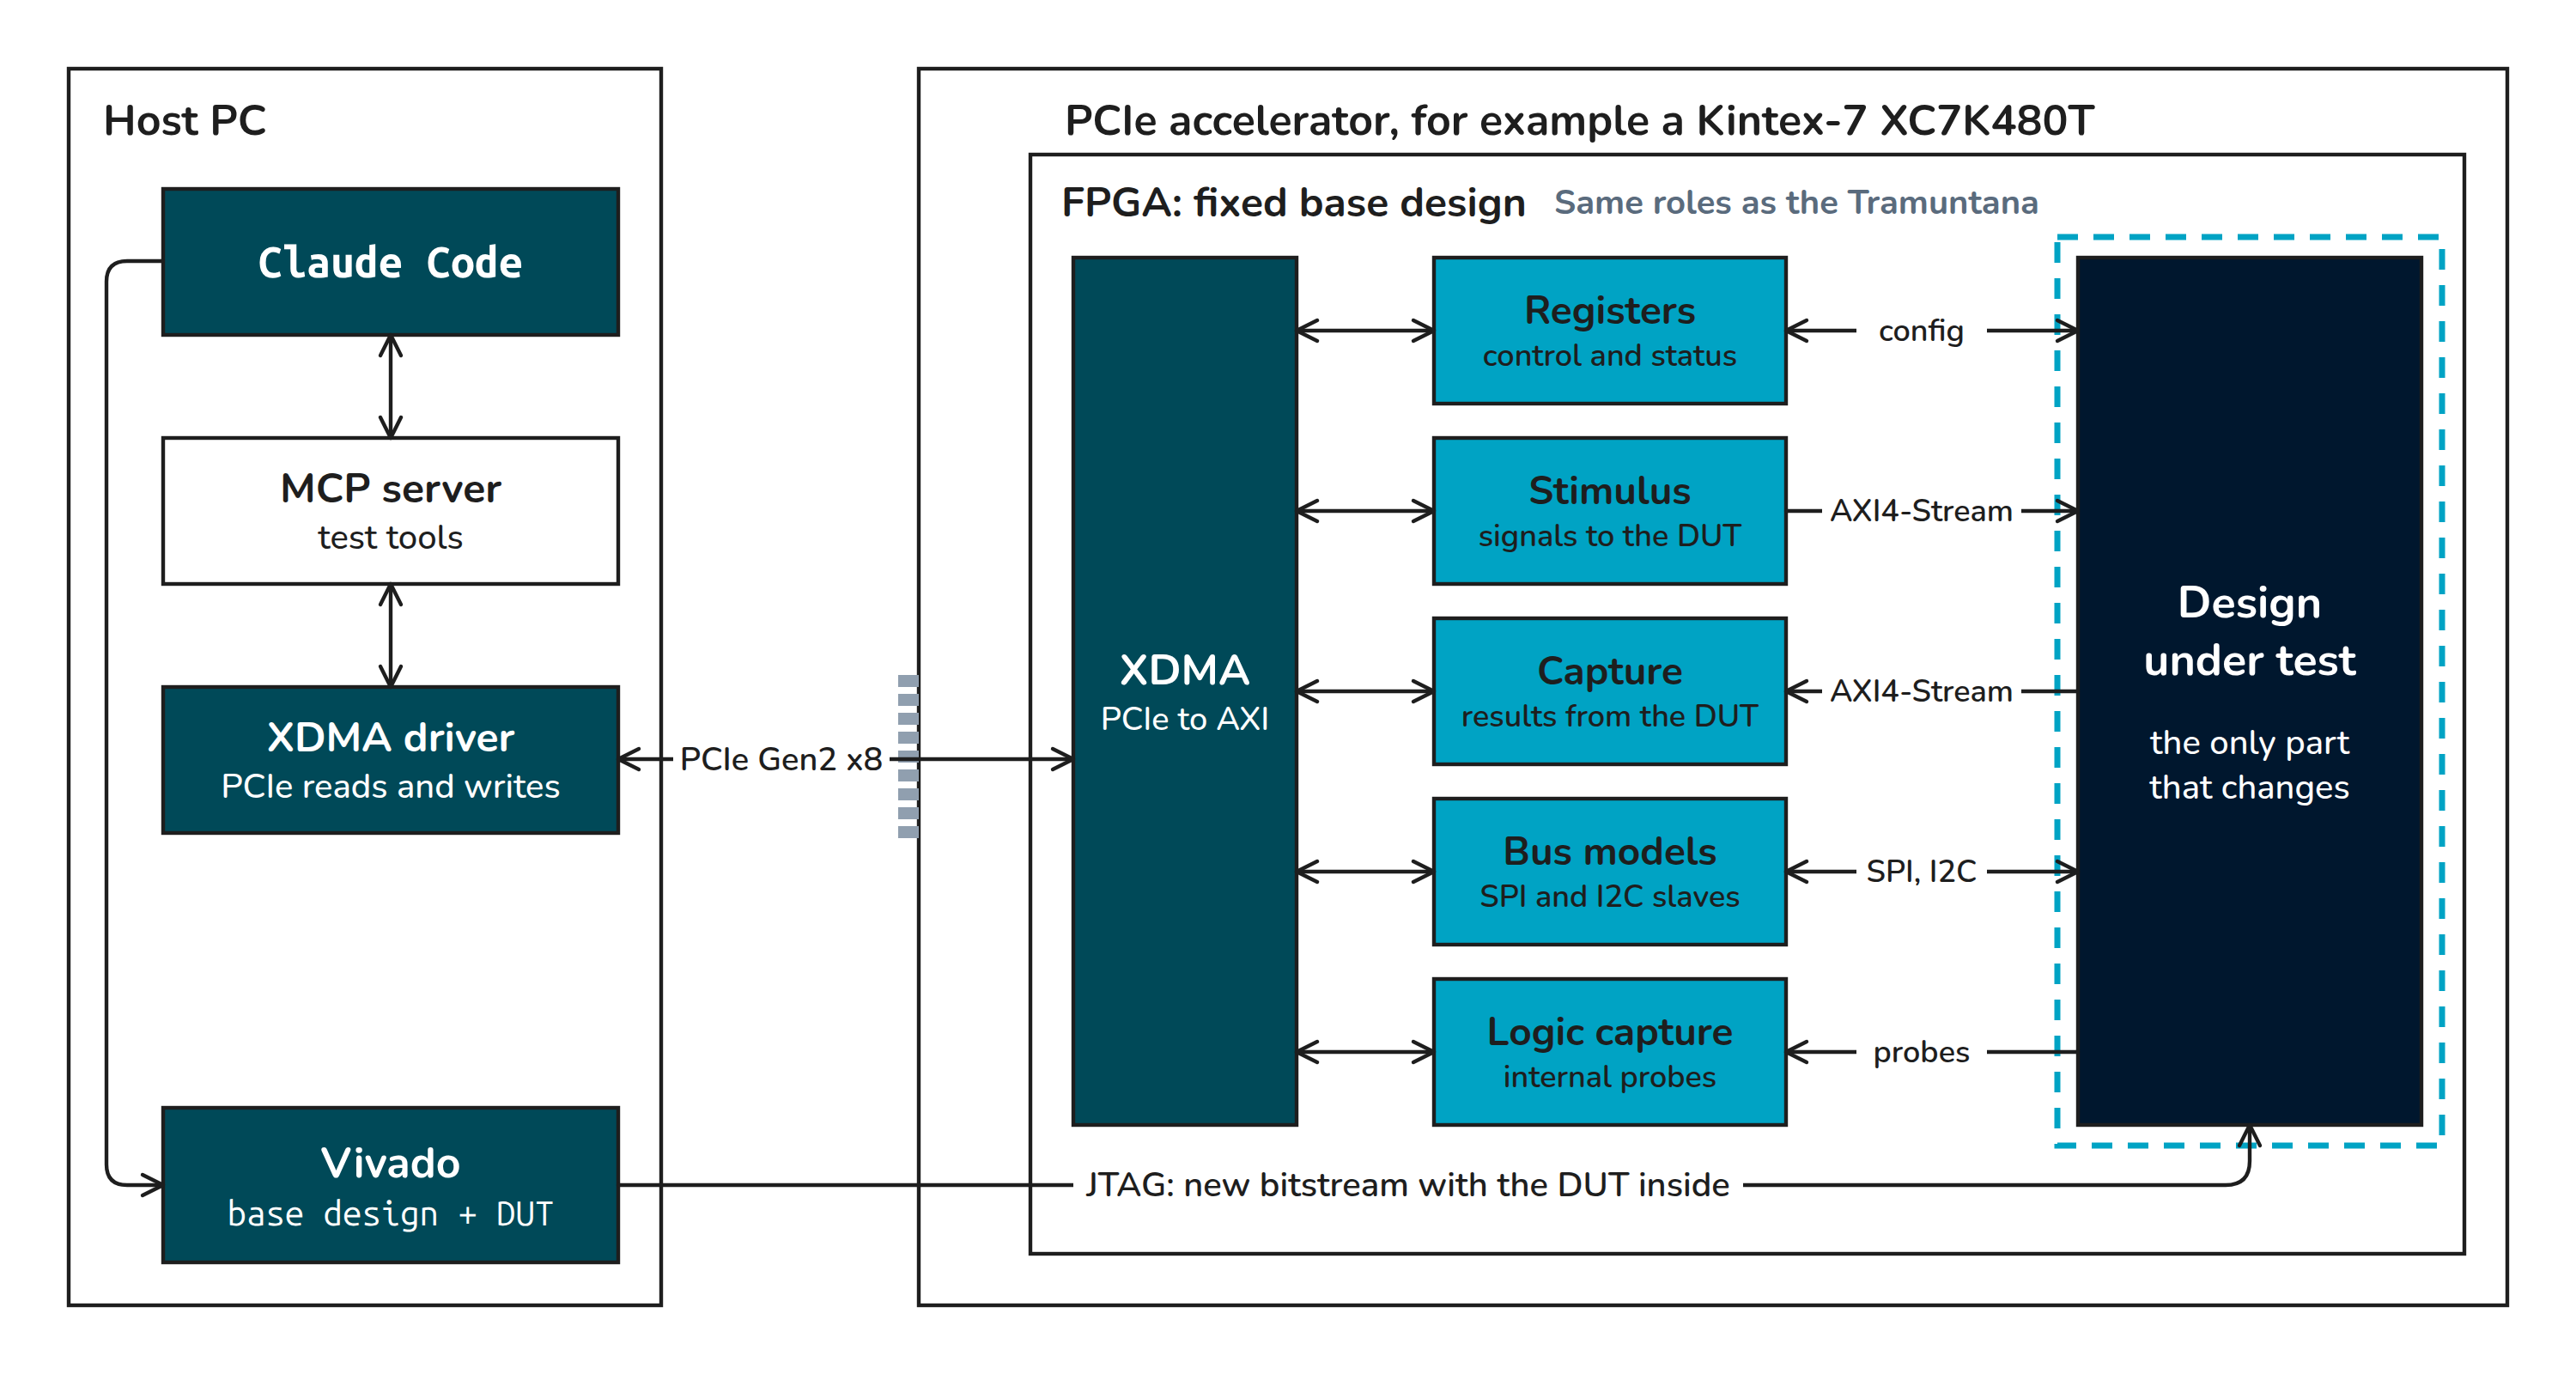
The flow would be this. Vivado compiles the base design together with the module under test, and the bitstream is loaded over JTAG or directly through the PCIe interface. Claude Code configures the test over PCIe, through an MCP server and the XDMA driver. The blocks of the base design send stimuli to the module, act as SPI or I2C slaves if needed, and capture results and internal signals. Finally, Claude reads the results and, if something fails, goes back to the RTL. Between tests only the module changes.
Why is this interesting? These cards, like the Kintex-7 accelerator I showed some time ago, have no GPIO, so the Tramuntana and the Pmods are useless with them. In exchange, they are cheap and have a lot of logic: the K480T costs less than 80 USD. Also, a good part of the harness already exists. stream_test_shell.v groups registers, stimulus and capture memories, and leaves the module between m_axis and s_axis:
module stream_test_shell #(
  parameter id = 32'h00000000, /* value of register 13 */
  parameter depth_bits = 12 /* harness memories: 2^depth_bits words */
)(
  input aclk, /* system clock */
  input resetn, /* active low synchronous reset */

  /* SPI from the Tramuntana */
  input spi_csn, /* chip select */
  input spi_sclk, /* clock */
  input spi_mosi, /* master out */
  output spi_miso, /* master in, tri-stated while CSn is high */

  /* To and from the DUT */
  output [31:0] m_axis_tdata, /* sample to the DUT */
  output m_axis_tlast, /* last sample of the run */
  output m_axis_tvalid, /* sample valid */
  input m_axis_tready, /* DUT ready */
  input [31:0] s_axis_tdata, /* DUT result */
  input s_axis_tvalid, /* DUT result valid */
  ...
Today it is controlled over SPI from the Tramuntana, and in the accelerator that link would become XDMA. Since the memories decouple the module from the link, the module can run at the full aclk speed. This is how both options compare:
| Tramuntana + Arty | PCIe accelerator | |
|---|---|---|
| Connection | wires to the Pmod | PCIe, no wires |
| Instruments | external board | logic inside the FPGA |
| Real pins and buses | yes | no, everything is internal |
| Independent observer | yes | no, it shares the FPGA with the module |
| Cost in the FPGA | only the test top | the base design takes logic |
| Tools | open-source flow | Vivado for the XDMA IP |
There are some things to solve, and the most important one is that I lose the independent observer. For example, I remember a bug we found in an SPI interface that was related to a delay in the CS line, and that delay depended on where the P&R placed the SPI module within the FPGA. This kind of bug would be undetectable in this setup.
So my conclusion is that this option does not replace the Tramuntana, it complements it. The accelerator is for internal logic, test volume and speed, and the Tramuntana is for everything that goes out through a pin.
Conclusions
After some months working this way, what I have learned is that the quality of what an AI generates for FPGA depends much more on the rules it reads and on the instrument that checks its work than on the model itself. Keeping the rules in a single knowledge base means that every improvement I make reaches every project and every tool. Self-checking testbenches, and a mutation test to check the testbenches, are what allow the agent to iterate in the simulation loop without me looking at waveforms.
The hardware loop is where the real value appears. For example, it detected a timing problem that was invisible to the FPGA’s own checks. Problems like this would never have been found in simulation, and some of them would not have been found without an observer independent from the FPGA. That is something I will keep in mind when I build the PCIe version, which for now is only an idea.
Do I have a finished workflow that will be valid for years? Absolutely not. New models will arrive, and new ways of working will replace these ones, probably in less than a year, but keeping a workflow like the one I have presented here up to date will make the difference.